
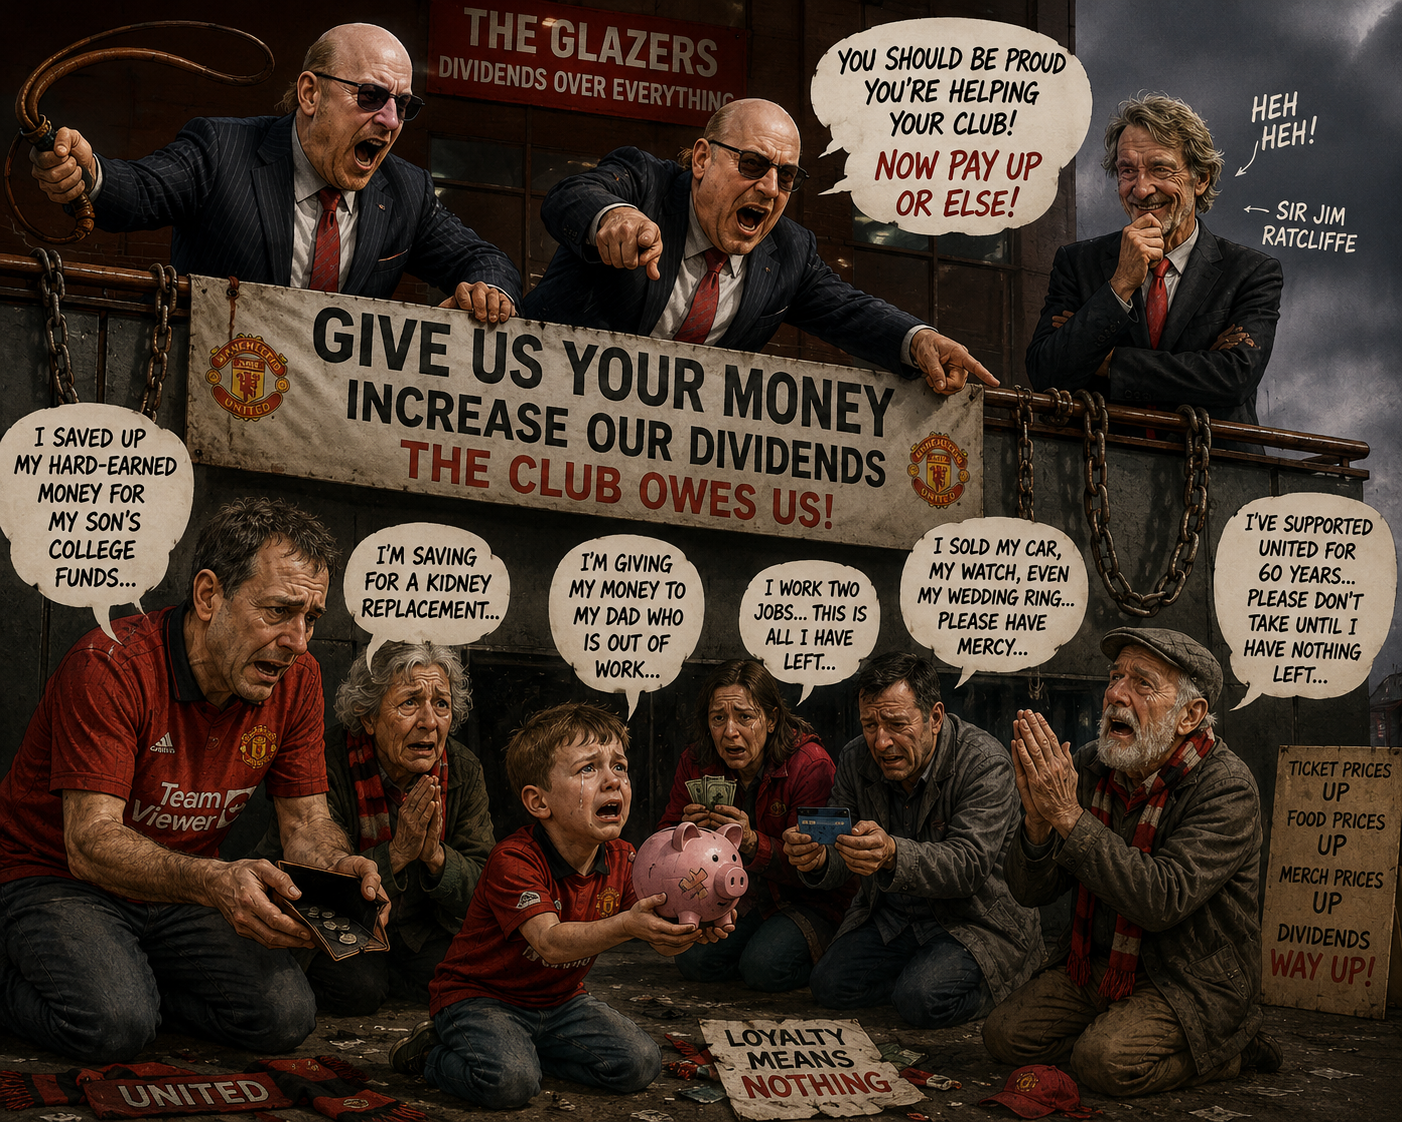
The Financial Destruction of Manchester United
Glazernomics.
In 2005, the Glazer family bought Manchester United using the club's own future earnings as collateral. They put in zero pounds of their own money. What followed was 20 years of debt, extraction, and decline — while rival clubs invested and won. This is the story in numbers.
£1.1B
Debt loaded onto club
Paid by the club, not the Glazers
£897M
Extracted in fees & dividends
Since 2005 takeover
£0
Of their own money invested
The Glazers put in nothing
13
Years without a league title
Last won in 2013 under Ferguson
£1.5B
Net spend deficit vs rivals
vs City & Chelsea 2013–2023
68%
Commercial growth stalled
vs 180%+ at rival clubs
The proof in black and white
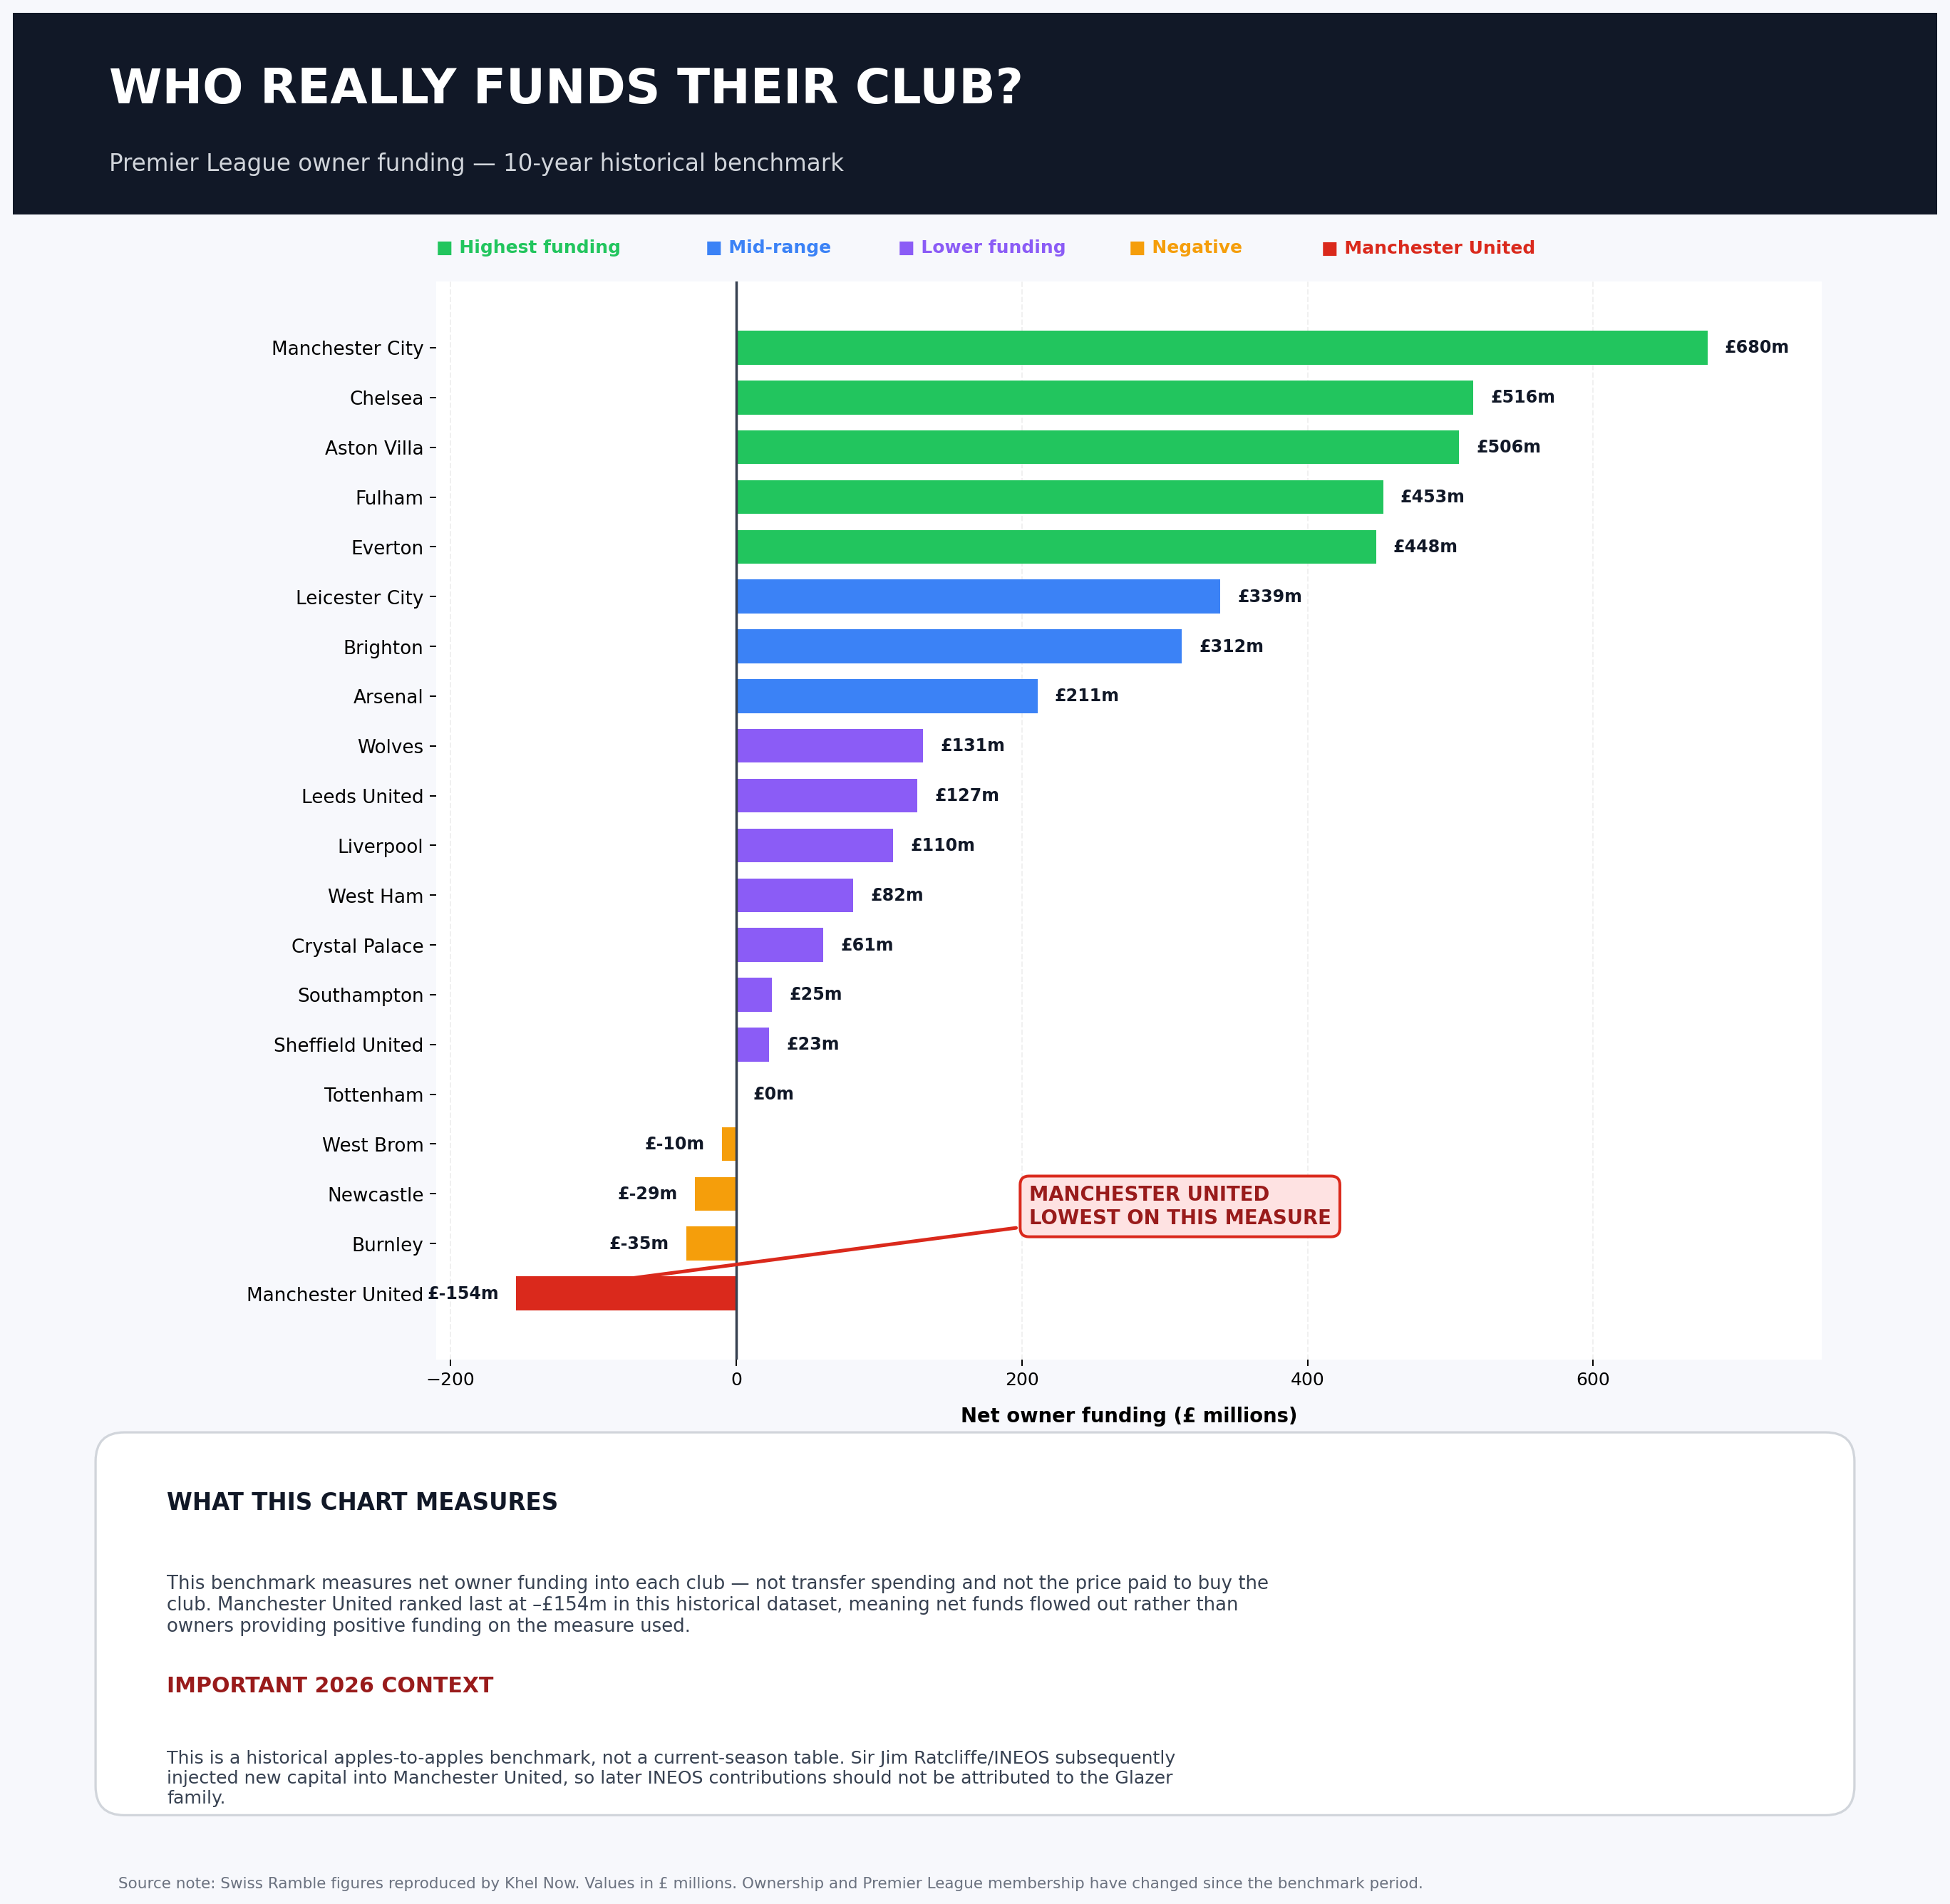
Who Really Funds Their Club?
Net owner funding across all 20 Premier League clubs over a 10-year historical benchmark. Manchester United ranks dead last — the only club where money flowed out rather than in.
How it happened
The Leveraged Buyout Explained
Glazers borrow £525M
The Glazer family borrowed £525 million from banks and hedge funds at punishing interest rates — secured not against their own assets, but against Manchester United itself.
Debt loaded onto the club
Once the takeover completed, that £525M debt — plus a further £135M in existing debt — was transferred directly onto Manchester United's balance sheet. The club now owed the money, not the Glazers.
Fans pay the interest
Every ticket sold, every shirt bought, every TV deal signed — a significant portion went straight to servicing debt the Glazers created. Over £685M in interest payments alone since 2005.
"It is the most successful leveraged buyout in sports history — successful for the buyers, that is. For the club and its fans, it has been a financial catastrophe."
— Financial Times analysis, 2021
20 years of debt
Club Debt Since Takeover
Net debt in £ millions. The club has never been debt-free since the Glazers arrived.
Hover bars for key events. Sources: Man Utd annual reports, Deloitte Football Money League.
Greed on display
Dividends Paid to the Glazers
Annual dividends in £ millions — paid to the Glazer family every single year. Total: £222M+
Hover bars for context. Sources: Man Utd annual reports, Companies House filings.
Money out, nothing in
What the Glazers Extracted
While the club's debt mounted, the Glazer family extracted money through multiple channels. Total extracted: £976M+
What £976M Could Have Bought
Erling Haaland
£51M
Transfer fee paid by Man City, 2022
Kylian Mbappé
£180M
Transfer fee paid by Real Madrid, 2024
Average EPL club annual wages
£180M
Approximate average Premier League club wages
Old Trafford full rebuild
£2,000M
Estimated cost of a new 90,000-seat stadium
The £976M+ extracted by the Glazers could have funded 19 Erling Haalands, rebuilt Old Trafford to world-class standard, or funded a decade of elite transfer activity. Instead, it left the club.
While United stood still
Rivals Invested. United Extracted.
| Club | Net Transfer Spend 2013–2023 | League Titles | UCL Titles |
|---|---|---|---|
| Manchester City | £1.4B | 7 | 1 |
| Chelsea | £1.2B | 2 | 2 |
| Liverpool | £780M | 1 | 1 |
| Arsenal | £620M | 0 | 0 |
| Manchester United— spent big, won nothing | £850M* | 0 | 0 |
* United's gross spend was high but net spend (after sales) was significantly lower. Sources: Transfermarkt, UEFA, Premier League.
The Theatre of Dreams — neglected
Old Trafford: A Stadium in Decay
Old Trafford — once the jewel of English football — has been allowed to deteriorate under Glazer ownership. Leaking roofs, broken seats, crumbling concourses, and outdated facilities have become the norm.
While rivals built new stadiums or undertook major renovations — Tottenham's £1B new ground, Arsenal's Emirates, Liverpool's expanded Anfield — United's ground has received minimal investment.
The estimated cost to rebuild Old Trafford to a modern standard is £1.5–2 billion. The Glazers extracted nearly that much from the club. The money was there. The will was not.
Leaking roof sections
Unresolved for 10+ years
Broken/missing seats
Ongoing complaints from fans
Outdated concourse facilities
No major upgrade since 2006
Capacity vs rivals
74,000 vs Spurs 62,000 (new)
Stadium revenue per seat
Below Spurs, Arsenal, Liverpool
Planned rebuild timeline
Still unconfirmed as of 2026
Share Glazernomics
The Numbers Don't Lie.
£1.1 billion of debt. £897 million extracted. Zero pounds invested. Twenty years of decline. Now you know what Glazernomics really means.